

I. Why Indian industry needs more than MSME sops (source:mint)
Recent relief measures for MSMEs may have come a bit late, with MSME firms showing signs of recovery after bottoming out in fiscal 2016.
With few months left for the 2019 general elections, the Union government has unveiled a slew of measures to woo India’s small and medium scale businesses, which have ostensibly been hurt the most because of the double whammy of demonetization and the goods and services tax (GST).The steps announced in recent weeks ranging from doubling the exemption limit for GST registration to restructuring stressed loans for the sector may be well intentioned but may be too little, too late to address the industrial sector’s woes.
Data from the Centre for Monitoring Indian Economy (CMIE’s) Prowess database which tracks the performance of more than 40,000 companies across India suggests that the performance of the MSME sector has been broadly in line with the rest of the corporate sector, and have shown signs of a recovery in the past fiscal year. Net sales for both set of firms fell between fiscal 2012 and fiscal 2016 before improving slightly since then.
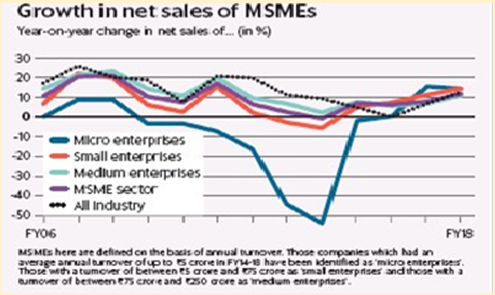
In this analysis, the enterprises are classified on the basis of their average annual turnover in the last five years. Companies with revenue of up to Rs. 5 crore in FY14-FY18 are considered ‘micro enterprises’, those with turnover between Rs. 5 crore and Rs. 75 crore as ‘small enterprises’ and those with turnover between Rs. 75 crore and ₹250 crore as ‘medium enterprises’. The classification is in line with the proposed new definition of the MSME sector, which was approved by the Union cabinet last year.
The improvement in net sales growth of these enterprises is almost entirely led by the manufacturing units. Sales growth in the services sector, on the other hand, declined for the third consecutive year in 2017-18.
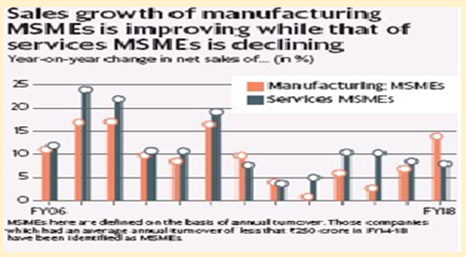
To be sure, the improvement in net sales of manufacturing firms does not necessarily suggest an improvement in profits. The data on aggregate profits suffers from extreme volatility and it is therefore difficult to identify a conclusive trend.
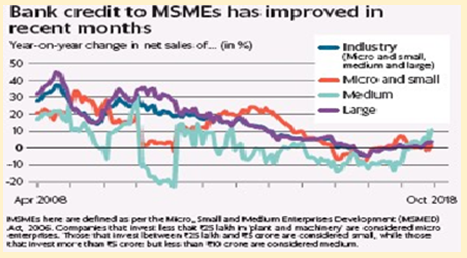
Data on bank credit sourced from the Reserve Bank of India, which classifies the MSME sector as per the current official definition based on investments of enterprises in plant, machinery and equipment, shows that industrial credit growth has also improved in recent months, with the entire improvement led by credit growth to mediumsized enterprises.
The trends in sales growth and credit flow largely represent the health of companies in the organized MSME sector but it is worth noting that the relief measures of the government are also aimed precisely at this sector since firms in the unorganized sector are outside the purview of regulatory controls and formal lending channels. The one area which seems to be of concern is jobs.
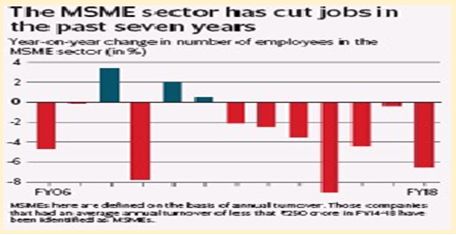
The small and medium-sized enterprises (based on turnover) cut jobs for the seventh straight year in 2017-18, even as the corporate sector as a whole witnessed rising employment in recent years.
While demonetization and GST are blamed for the financial distress of these enterprises due to which many were said to have laid off employees or shut operations, the fall in employment was the least in the demonetization year of 2016-17. Instead, the declining growth in employment in smaller sized companies has been an ongoing trend since FY10.
Some relief for the MSME sector may therefore seem warranted given their contribution to overall employment but it is worth noting that size based policy relief measures may end up being counter productive over the long run. Such measures could discourage firms to grow by creating strong incentives to operate beneath the official size category.
There is some evidence to suggest that size dependent labour regulations encourage smaller firms to employ non-permanent workers and make them subcontract output to other firms.
A recent survey conducted by IDFC Institute in collaboration with the government’s think tank NITI Aayog shows that larger firms face more regulatory obstacles, which possibly explains why firms in India fail to grow big.
Policy makers would do well to focus on the structural bottlenecks holding back Indian industry including regulatory red tape, uncertainties in tax and investment policies and infrastructural deficits which hurt both small and big firms and limit growth.
II. How household debt becomes part of governments public debt (source-mint)
On 1 February, finance minister will announce the interim budget and invariably attention will focus on the government’s public debt. India has one of the highest debt to GDP ratios among emerging markets and many fear this ratio may rise with bail outs of weak state run banks.
Although bank bailouts get most attention for inflating public debt, they may not be the key reason for increased public debt globally, a new study of International Monetary Fund suggests.
They find that the debt of common households and firms and not bank rescue packages of financial institutions, deserve much of the blame for inflating public debt and increasing the overall debt burden of advanced economies in recent years.
When indebted households and firms try to cut their own debt, they usually reduce their spending and investments which slows down the economy. This prompts governments to spend more to kick start the economy. More spending requires government borrowings which deteriorates public finances and increases public debt.
The authors suggest that this is also a form of bailout as the overly indebted individuals and firms get indirect relief and this pushes up the public finance burden for all.
This explains why the total stock of debt in the advanced economies has increased markedly since the global financial crisis. During this period, as the private sector was trying to ease its debt burden, governments were forced to take on new debt.
The authors analyse historical data to find a recurring pattern where households and firms are forced to deleverage in the face of a debt overhang, dampening growth and eliciting the injection of public money to kick start the economy.
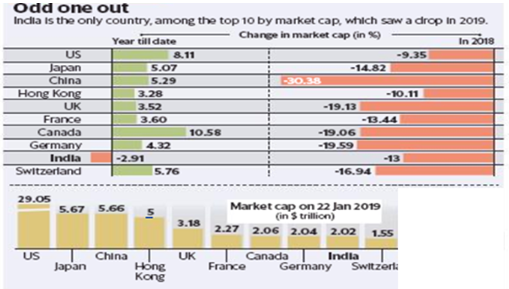
III. India’s total market cap plunges 2.91 % this year (source - mint)
With current m cap of $ 2.02 Trillion, India ranks ninth among biggest bourse.
India’s total market capitalisation has slipped significantly this year, even though the benchmark equity indices remained fairly firm. Market capitalisation of India was down 2.91% in dollar terms from what it was in the beginning of the year. During the same period, the BSE Sensex gained 1.04 % in rupee terms, but fell 1.13 % in dollar terms.
India is the only one, among the top 10 countries by market cap, which saw a drop in 2019.Canada has gained the most, up 10.58%. With a current market cap of$ 2.02 trillion, India ranks ninth in the league table of the world’s biggest stock markets. In December, India had climbed to the seventh position briefly, but was subsequently toppled by Canada and Germany at seventh and eighth positions, respectively, this year. Gaining 4.32% this year, Germany’s current market cap stands at $2.04 trillion, while Canada is at $2.06 trillion.
In rupee terms, aggregate market cap of all listed companies on Indian bourses has fallen1.17% from Rs. 144.48 trillion in start of 2019 to Rs. 142.79 trillion.
According to analysts, non-participation of the broader markets in the rally is the real reason for the aggregate market capitalisation not reflecting the true picture. There is lot of disparity in the stock performance. Only a handful of stocks are driving the index performance. There is a lack of broad based participation in the markets. Similarly, mid and small cap stocks are also under pressure and could have depressed the overall market cap. So, it is very narrow rally at index.
Share of both BSE Midcap and BSE Small cap in the overall market capitalisation has decreased, while that of the sensex has grown from January 2018 till now. In contrast, contribution of the sensex to India’s total market cap has grown from 39.7% in January last year to 45.6% at current levels.
The Indian rupee,meanwhile is still the worst performing currency among Asian peers. After weakening 8.46%last year, the rupee is already down 2.08% in 2009.
Currency fluctuations, stretched valuations and volatility in the markets are already keeping foreign institutional investors away from Indian equities. In 2019, FIIs have been net sellers of Indian shares worth $372.62 million, while domestic institutional investors were net buyers of equities worth Rs. 2,278.96 crore.
Conclusion:
It is not that FIIs are pulling out money from India alone, but from across emerging markets. Secondly, US interest rates were rising or are expected to rise, while Indian markets were looking overtly expensive, which are reasons for foreign investors selling in India.
Currently, valuations have eased off a bit, which is again not broad based and India is still expensive compared to peers. FIIs are getting better bargains in their own markets.
Hope you enjoyed reading this edition.
Disclaimer:
The views of the authors/publishers should not be construed as advice. Investors must make their own investment decisions based on their specific investment objectives and financial positions and using qualified advisors as may be necessary. Opinions expressed in various articles are not necessarily those of Wealthmax Enterprises Management Private Limited(WEMPL) or any of its directors, officers, employees and personnel. Consequently, WEMPL or any of its directors, officers, employees and personnel do not accept any responsibility for the editorial content or its accuracy, completeness or reliability and hereby disclaim any liability with regard to the same. Stock picks and mutual fund snapshots are not exhaustive and should not be construed as recommendations.